Importing Libraries
import numpy as np
import matplotlib.pyplot as plt
import pandas as pd
import matplotlib as mpl
Custom Variable Scoring Function
def variable_score(X_train,Y_train):


    #__________________Decision_Tree_____________________________________
    from sklearn.ensemble import ExtraTreesClassifier

    model = ExtraTreesClassifier()
    model.fit(X_train, Y_train)

    tree_importance = zip(X_test.columns, model.feature_importances_.tolist())
    tree_importance = np.asarray(list(tree_importance))
    tree_importance = np.sort(tree_importance, axis = 0)[::-1]
    tree_importance = pd.DataFrame(tree_importance, columns = ['Feature','Tree_Importance_Score'])
    tree_importance.set_index('Feature', inplace=True)

    feature_importance = tree_importance

    #__________________Correlation_____________________________________


    import math

    cor_list = []

    for column in X_train.columns:
        list_to_append = [column, X_train[column].corr(Y_train)]
        if math.isnan(list_to_append[1]):
            list_to_append[1] = 0
        cor_list.append(list_to_append)

    cor_list = np.asarray(cor_list)
    cor_list = np.sort(cor_list, axis = 0)[::-1]
    cor_list = pd.DataFrame(cor_list, columns = ['Feature','Correlation_with_Target'])
    cor_list.set_index('Feature', inplace=True)

    feature_importance = feature_importance.join(cor_list)

    return feature_importance
Reading in Data
df = pd.read_csv('LendingClub2012to2013.csv', skiprows=1, low_memory=False)
print(df.shape)

df = df[pd.notnull(df['loan_status'])]

# Keeping a backup copy of the data
df_orginal = df.copy()
(188183, 115)
Initial Dropping
Dropping variables is initally based on percent of values missing and text columns with too many different classes.
not_missing = df.apply(lambda x: (x.count()/df.shape[0])).sort_values()
not_missing = not_missing[not_missing < .5]
print(not_missing)
not_missing = not_missing.index.values.tolist()
df.drop(not_missing, axis=1, inplace = True)
annual_inc_joint                  0.000000
inq_fi                            0.000000
all_util                          0.000000
max_bal_bc                        0.000000
open_rv_24m                       0.000000
open_rv_12m                       0.000000
il_util                           0.000000
total_cu_tl                       0.000000
total_bal_il                      0.000000
open_il_24m                       0.000000
open_il_12m                       0.000000
open_il_6m                        0.000000
open_acc_6m                       0.000000
verification_status_joint         0.000000
dti_joint                         0.000000
mths_since_rcnt_il                0.000000
inq_last_12m                      0.000000
next_pymnt_d                      0.088883
mths_since_last_record            0.092857
mths_since_last_major_derog       0.172791
mths_since_recent_bc_dlq          0.195296
mths_since_recent_revol_delinq    0.289333
mths_since_last_delinq            0.428354
desc                              0.432977
dtype: float64
df_obj = df.select_dtypes(include = ['object'])
too_many = df_obj.apply(lambda x: (x.nunique() / df.shape[0])).sort_values(ascending=False)
print(too_many)
too_many = too_many[too_many >= .2].index.values.tolist()
df.drop(too_many, axis=1, inplace = True)
id                     1.000000
url                    1.000000
emp_title              0.612102
title                  0.238839
revol_util             0.005675
zip_code               0.004458
earliest_cr_line       0.003263
int_rate               0.000771
last_credit_pull_d     0.000319
last_pymnt_d           0.000314
addr_state             0.000260
sub_grade              0.000186
issue_d                0.000128
purpose                0.000069
emp_length             0.000058
loan_status            0.000037
grade                  0.000037
home_ownership         0.000027
verification_status    0.000016
term                   0.000011
initial_list_status    0.000011
application_type       0.000005
pymnt_plan             0.000005
dtype: float64
Data Transformation
Label econding, imputation, train/test split
# Label encoding

from sklearn.preprocessing import LabelEncoder

label = LabelEncoder()
cols = df.select_dtypes(include = ['object']).keys().tolist()
for column in cols:
    df[column] = label.fit_transform(df[column].astype('str'))
# Imputation: Median

df.fillna(df.median(), inplace = True)
# Train/Test Splits

Y = df['loan_status']
X = df.drop('loan_status',axis=1)

from sklearn.model_selection import train_test_split

# Generating the final test set:
X_train, X_test_final_test, Y_train, Y_final_test = train_test_split(X,Y, test_size = .2)

# Generating the expirment set:
X_train, X_test, Y_train, Y_test = train_test_split(X_train,Y_train, test_size = .1)

print("Final test size: " + str(Y_final_test.shape[0]))
print("Intermediate test size: " + str(Y_test.shape[0]))
print("Training size: " + str(Y_train.shape[0]))
Final test size: 37637
Intermediate test size: 15055
Training size: 135489
# Scale

from sklearn.preprocessing import StandardScaler

scaler = StandardScaler()
X_train = pd.DataFrame(scaler.fit_transform(X_train), columns=X_train.columns)
Removing Features with Little Variance
from sklearn.feature_selection import VarianceThreshold

print('Features:',X_train.shape[1])

# Remove all features that are either one or zero (on or off) in more than 90% of the samples
# http://scikit-learn.org/stable/modules/feature_selection.html
selector = VarianceThreshold(threshold=(.9 * (1 - .9)))
selector = selector.fit(X_train)

selector.get_support

variance = zip(X_test.columns, selector.get_support())
variance = np.asarray(list(variance))


below_threshold = variance[variance[:,1] == 'False'][:,0]
print('Feature(s) to be dropped:', below_threshold)


labels = X_train.columns.tolist()

# List Comprehension to remove labels: https://stackoverflow.com/questions/4211209/remove-all-the-elements-that-occur-in-one-list-from-another
labels = [x for x in labels if x not in below_threshold]
X_train = pd.DataFrame(selector.fit_transform(X_train), columns=labels)
print('Features:',X_train.shape[1])
Features: 86
Feature(s) to be dropped: ['pymnt_plan' 'policy_code' 'application_type']
Features: 83
Finding Variable Importance with Correlation and Random Forest
df = variable_score(X_train,Y_train)
df.sort_values('Tree_Importance_Score')[::-1].head(10)
| Tree_Importance_Score | Correlation_with_Target | |
|---|---|---|
| Feature | ||
| zip_code | 8.206404938300277e-05 | 9.05799017886097e-05 |
| verification_status | 5.368457724594576e-05 | 0.006985712324612762 |
| total_rev_hi_lim | 3.8450493069382144e-05 | 0.006453755025627213 |
| total_rec_prncp | 2.929757586780374e-05 | 0.005947541594535856 |
| total_rec_late_fee | 2.3402103757702527e-05 | 0.005683856517796645 |
| total_rec_int | 0.10177860331002972 | 0.004814525409741282 |
| total_pymnt_inv | 0.09515163532375359 | 0.0036057409102408016 |
| total_pymnt | 0.09503450247976335 | 0.003560534801558149 |
| total_acc | 0.07831017202339975 | 0.0027663034269301066 |
| tot_hi_cred_lim | 0.070266255189276 | 0.0025077576084473175 |
key_columns= df.sort_values('Tree_Importance_Score')[::-1].head(10).index.tolist()
df_orginal[key_columns].info()
<class 'pandas.core.frame.DataFrame'>
Int64Index: 188181 entries, 0 to 188180
Data columns (total 10 columns):
zip_code               188181 non-null object
verification_status    188181 non-null object
total_rev_hi_lim       160440 non-null float64
total_rec_prncp        188181 non-null float64
total_rec_late_fee     188181 non-null float64
total_rec_int          188181 non-null float64
total_pymnt_inv        188181 non-null float64
total_pymnt            188181 non-null float64
total_acc              188181 non-null float64
tot_hi_cred_lim        160440 non-null float64
dtypes: float64(8), object(2)
memory usage: 15.8+ MB
df_orginal[key_columns].head()
| zip_code | verification_status | total_rev_hi_lim | total_rec_prncp | total_rec_late_fee | total_rec_int | total_pymnt_inv | total_pymnt | total_acc | tot_hi_cred_lim | |
|---|---|---|---|---|---|---|---|---|---|---|
| 0 | 100xx | Verified | 43100.0 | 20800.00 | 0.0 | 3126.64 | 23926.64 | 23926.64001 | 41.0 | 43100.0 |
| 1 | 060xx | Not Verified | 61100.0 | 11633.82 | 0.0 | 1261.93 | 12895.75 | 12895.75000 | 22.0 | 333044.0 |
| 2 | 281xx | Not Verified | 29700.0 | 12000.00 | 0.0 | 1988.61 | 13988.61 | 13988.61000 | 18.0 | 29700.0 |
| 3 | 871xx | Source Verified | 8100.0 | 12000.00 | 0.0 | 1359.78 | 13359.78 | 13359.77686 | 32.0 | 18130.0 |
| 4 | 493xx | Verified | 28200.0 | 24000.00 | 0.0 | 4652.21 | 28652.21 | 28652.21000 | 39.0 | 229072.0 |
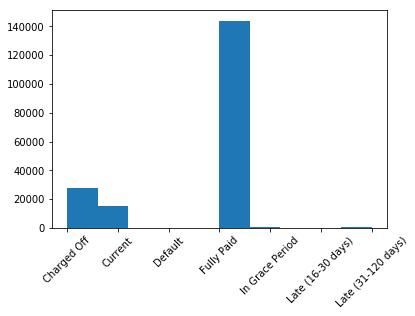
Plotting the Data
The target variable is loan status
# Target Variable

plt.hist(x='loan_status',data=df_orginal)
mpl.rcParams['figure.figsize'] = (5,5)
plt.xticks(rotation=45)
# plt.savefig('foo.png',bbox_inches="tight")
plt.show()
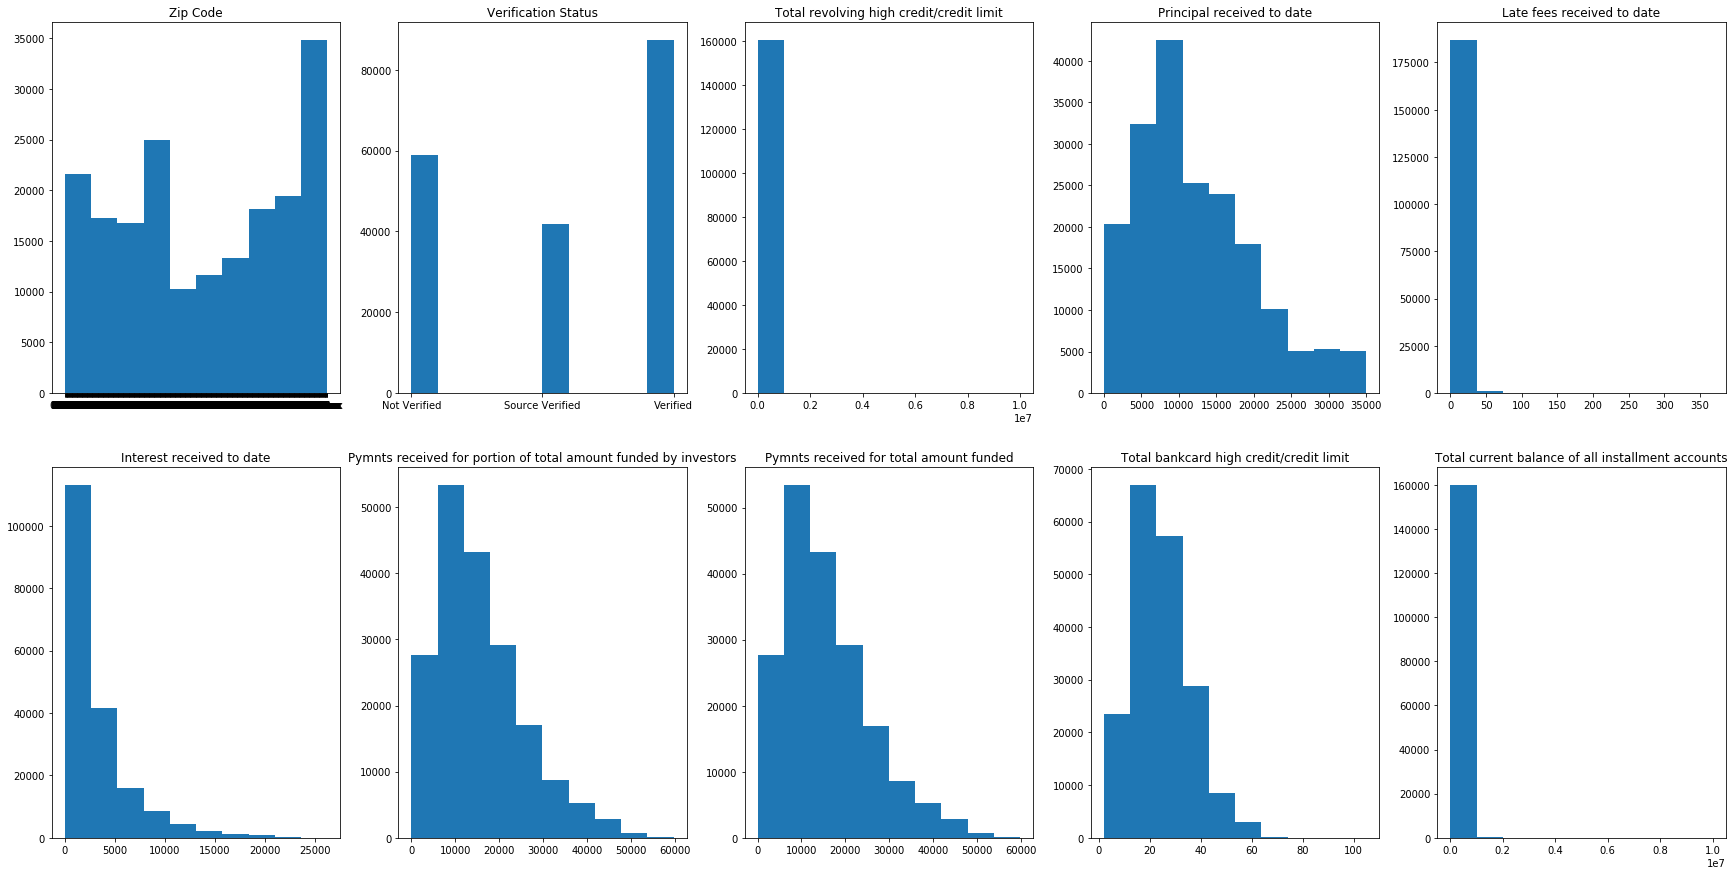
Below is chart for the top ten feature variables
# Top feature charts

fig, axs = plt.subplots(2,5, figsize=(30, 15))
axs = axs.ravel()

titles = ['Zip Code','Verification Status','Total revolving high credit/credit limit',
         'Principal received to date','Late fees received to date','Interest received to date',
         'Pymnts received for portion of total amount funded by investors',
         'Pymnts received for total amount funded','Total bankcard high credit/credit limit',
         'Total current balance of all installment accounts']

for i, column in enumerate(key_columns):

    axs[i].hist(x=column,data=df_orginal[pd.notnull(df_orginal[column])])
    axs[i].set_title(titles[i])

# plt.savefig('foo2.png',bbox_inches="tight")